We always heard about Big Data. So, what you know about Data?
Data is a bundle of figures, typically raw and unprocessed. It’s representing observations, measurements, or representations of real-world entities, events, or phenomena. It serves as the foundation for analysis, decision-making, and the generation of knowledge and insights. Data can be categorized as structured or unstructured. Structured data is organized in a predefined format, often represented in databases with well-defined schemas.
What is Unstructured Data?

Unstructured data refers to information that does not have a predefined or organized format. It lacks a specific data model and does not fit neatly into traditional rows, columns, or tables typically found in structured databases. Unstructured data is characterized by its diverse and free-form nature. It includes text documents, emails, social media posts, videos, images, audio recordings, and other sources of information that do not fit neatly into traditional databases or structured formats.
Importance to Structure the data from Unstructured Data
Structuring data from unstructured data has numerous benefits in a range of contexts and disciplines, from business analytics to scientific research. Structuring unstructured data brings order to chaos, increases efficiency, and opens up many possibilities for data analysis and information extraction. It plays a crucial role in the era of big data, where data-driven decisions can give businesses a competitive edge.
Here are some of the key reasons why it is important:


How to utilise your structured data in your business?
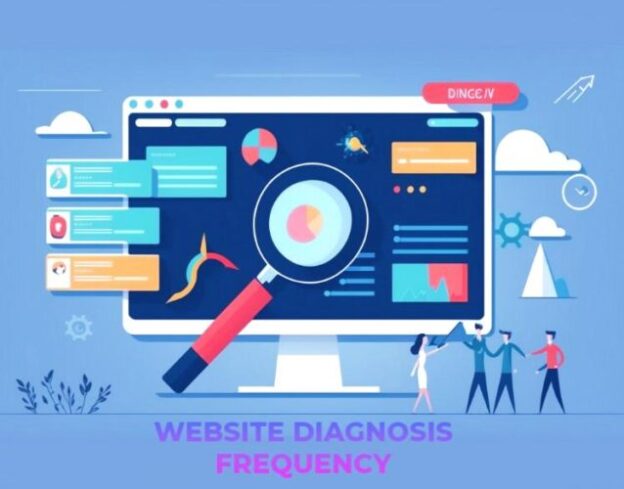
♦Step#1: Data Visualization and Analysis
Data visualization acts as a powerful tool for transforming structured data into actionable knowledge. It enables you to unearth valuable patterns and trends within your data, empowering you to make informed business decisions, enhance customer experiences, and gain a competitive edge in the market.
Once you have visualized your structured data, you may uncover valuable insights and patterns related to your customers’ buying behavior, preferred products, influential factors in their purchase decisions, and more. These discoveries are akin to striking gold within your data, as they can provide a deep understanding of your customers and drive strategic business decisions.
 |
By analyzing visual representations of your data, you might identify correlations between different variables, such as customer demographics and product preferences, seasonal trends impacting sales, or the effectiveness of marketing campaigns across various channels. These insights can guide you in tailoring your marketing strategies, optimizing inventory management, improving customer experiences, and ultimately driving revenue growth. |
Moreover, data visualization allows you to communicate these findings effectively to stakeholders within your organization. Visual representations, such as charts, graphs, and infographics, provide a clear and concise means of conveying complex information. By sharing these visuals, you can facilitate data-driven discussions, align your teams around key insights, and foster a more informed decision-making process.
♦Step#2: Planning & Marketing Implementation
It’s not enough to collect and analyze your customers’ buying information through data visualization and analysis. The next crucial step is to translate those insights into effective marketing planning and implementation strategies, leveraging the power of the analyzed data.
With a deep understanding of your customers’ preferences, purchase behavior, and influential factors, you can craft targeted marketing campaigns that resonate with your target audience. The analyzed data can guide you in developing personalized messaging, identifying the most effective marketing channels, and tailoring your offerings to meet specific customer needs.
Based on the analyzed data, you can refine your customer segmentation and develop buyer personas to better understand your target audience. This enables you to create highly relevant and personalized marketing messages that address their pain points, highlight the benefits of your products or services, and ultimately drive conversion rates.
 |
The analyzed data can inform your media planning and optimization efforts. By identifying the channels and touchpoints that yield the highest return on investment, you can allocate your marketing budget more effectively and maximize the impact of your campaigns. Whether it’s social media advertising, email marketing, search engine optimization, or traditional advertising channels, the insights gained from data analysis can help you make informed decisions about where to allocate your resources. |
In addition to planning, the analyzed data can also guide the implementation of your marketing strategies. You can continuously monitor key metrics and performance indicators to assess the effectiveness of your campaigns in real-time. This allows you to make data-driven adjustments, optimize your marketing activities, and ensure that you are on track to meet your business goals.
In summary, data plays a crucial role in gaining valuable insights and propelling business growth to new heights through accurate data visualization and data analysis. Engaging a professional data visualization and analysis team is recommended to kickstart this process effectively.