
Since the announcement about Google ending support for Universal Analytics, it is required to shift to Google Analytics 4 and more opportunities to learn from the reports. This article will summarize the data aggregation methods that Google Analytics 4 is said to have changed significantly from Universal Analytics.
Introduction
App + Web Properties, which allows tracking across apps and the web, was released as a beta version and is now official as Google Analytics 4 (GA4).
The main reasons raised for GA4 are as follows:
1. To respond to major changes in consumer behavior.
2. to respond to the world’s growing emphasis on privacy
In recent years, with the rapid increase in the number of smartphone users, the medium used by users has expanded from the Web to mobile applications. With the current UA, access analysis for apps is difficult, and there is a problem of not being able to identify users across devices.
GA4 appeared in response to these changing times, and in order to grasp users who use all kinds of devices such as smartphones and apps and go through multiple platforms, it has become necessary to conduct access analysis across analysis of the complex consumption behavior and trends of users who move around websites and apps in all directions. This is because it has become necessary to analyze the complex consumption behavior and trends of users who move across websites, apps, and other platforms.
Therefore, GA4 offers the following advantages over traditional universal analytics.
- Users who browse the Web on a PC and then purchase from an mobile application can now be recognized as the same customer, even if they are using different devices.
- Now that we can measure on an event-by-event basis, more events can be measured automatically.
- BigQuery can be linked for free
- Enhanced machine learning analysis and insights to predict future behavior
As you can see from the above benefits, UA and GA4 have fundamentally changed the way data is measured: while UA converted data received in hits to session-based data, GA4 now collects it in events as user basis.
| Data Type | Universal Analytics (UA) | Google Analytics 4(GA4) |
| Page view | Measure as page view | Measure as events |
| Events | Measure as events | Measure as events |
| E-commerce | Measure as E-commerce | Measure as events |
| Custom Dimension | Measure as custom dimension | Dimension per hit = Measured as an event
Dimension per user = user property |
GA4 enables user-oriented analysis, so that after a user visits a website or application, it is possible to understand the behavior of the user up to the point of conversion through repeat visits.
Acquisition: Are the users leading to conversions and revenue?
Conversion: Are users who made conversion actions leading to revenue?
Revenue: What are the behaviors of revenue-generating users on the website and app?
User retention: What are the behaviors of users who continue to use the website?
Before starting analysis with GA4, it is necessary to organize the purpose of the website, the purpose of using the data, and the target figures as a basic premise.
For example, for an e-commerce site, the objective is to sell products and services, and the target figures should include which products were purchased the most, which users made the most purchases, and the monthly purchase amount, etc. For a BtoB site, the objective is to collect user information that can be used by sales and find potential customers. For a BtoB website, the objective is to collect user information that can be used by sales and to discover potential customers, which may include the number of inquiries received, the number of documents downloaded, and the number of e-mail magazine subscriptions.
It is very important to have a purpose for the website, the purpose of using the data, and the target values, so that the values measured by GA4 can be evaluated and improved.
In order to analyze GA4 data, reporting functions in the following 3 aggregation methods can be utilized.
1. Aggregate by GA4 report
・Standard report: Finding out a hypothesis
・Exploration report: Dig deeper into the issue based on the hypothesis
2.Aggregate in GA4x Looker studio
・Direct linkage with GA4: Check KPI and monitoring dimensions and metrics
3. Aggregation with GA4xBigQuery
・Link to BigQuery: Dig deeper into issues on a per-user basis
Here are the specifications and characteristics of each.
1. Aggregate by GA4 report
There are two types of report screens in GA4.
There are “Standard Reports” in a standardized format and “Exploration Reports” that users can create by recombining dimensions and indicators as they wish. The “Custom Report” in the traditional Universal Analytics (hereinafter referred to as UA) functionality becomes the “Exploration Report” in GA4.
Standard Reports

Standard Reports

Standard Report Aggregation Methods
GA4 standard reports are often used to formulate hypotheses to analyze. For example, we have an SEO strategy, but are repeat users looking at certain pages the most? Do users who lead to conversions tend to occur at certain events? We make hypotheses by looking at indicator figures such as the following.
The aggregation method of the standard report has an underlying database table, which displays aggregated data measured by GA4.

About some specifications:
If the result of multiplying the radix of each dimension in the report exceeds the maximum number of rows, “(other)” rows will appear in the Analytics.
※Reference:
https://support.google.com/analytics/answer/13208658?visit_id=638127301129422574-1591277467&rd=1&hl=en
In addition, dimensions with more than 500 unique values per day are considered high base numbers and are more likely to reach the report line limit (50,000 lines) and display “(other)” lines.
This does not only affect reports containing custom dimensions with more than 500 types of data, but all standard reports are affected.
Note that if the maximum number of rows is exceeded, (Other) rows will appear in all standard reports, increasing the likelihood of inaccurate measurements.
Additional reference 1:About radix
The radix is the number of unique values assigned to a dimension.
It is a combination of all dimensions in the property.
Some dimensions have a fixed number of unique values. For example, “device” has 3 (PC, tablet, mobile). On the other hand, a dimension with more than 500 unique values in a day is considered a High-Property Dimension.
In a high-likelihood dimension, the number of rows in the report will increase, increasing the likelihood that the upper limit will be reached. Data that exceeds the limit will be aggregated into “(other)” rows.

Aggregation Methods for Exploration Reports
GA4 exploratory reports are used to verify hypotheses made using standard reports. Unlike standard reports, exploratory reports cannot be created unless you have a clear idea of what you want to analyze, since it is necessary to customize the axis of analysis and indicators by yourself.

・Free-form
Graphs and tables can be created by combining indicators such as the number of accesses, users, and events with dimensions such as country, age, and day of the week.
・Funnel exploration
In this report is it possible for to visualize the percentage of the flow. For example, total number of visitors who made final conversion in the flow of TOP page → Column page → Contact form → Inquiry completed. We are able to find out how many users left the site during the steps or how many users lead to final step.
・Path exploration
It is possible to visualize where a user came from to visit the site, and the sequence of movements through the site and the application.
・Segment overlap
User segments can be compared to see the overlap between indicators.
For example, by looking at how many users satisfy the two segments of “visited from Bangkok” and “visited more than twice”, we can find the best customers.
・User explorer
A list of users can be displayed and detailed individual behavioral data can be viewed.
・Cohort exploration
You can visually see the number of repeat visits by users with common attributes. You can see, for example, “how many times the same user accessed the Web site.
・User lifetime
You can check the Lifetime Value (customer lifetime value), which includes the main referral sources that lead to conversions, the behavior of the first visit, and subsequent actions.
The aggregation method of the exploratory report is to set the items to be displayed in the report from the unprocessed data and refer to the report to be displayed by query.

About some specifications:
GA4 is designed for user privacy and thresholds are easily applied.
Selecting a high radix dimension will not produce an “other” line, but sampling and data thresholds are more likely to be applied.
※Reference:About data sampling https://support.google.com/analytics/answer/2637192
※Reference:[GA4] About data thresholds https://support.google.com/analytics/answer/9383630
Additional reference 1:Differences in data between standard and exploration reports
| Report type |
GA4 Data table ・Data that will be shown |
Sampling | Viewing “(other)” |
Standart report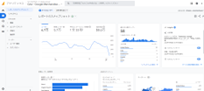 |
Data Tables: Aggregated
Referenced only from aggregated data tables |
None |
Yes If the combination of all dimensions in a property exceeds 50,000 rows |
Exploration report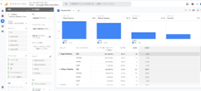 |
Data table: Unprocessed (not pre-aggregated)
Include and reference unprocessed data tables |
Yes
Free version:10 Million Events 360 (Paid version):Billion Events |
None |
Additional reference 2:Indication of the presence or absence of data thresholds

In some cases, events measured with thresholds applied may not be displayed in Settings (or Management) > Events. Also, the threshold may be applied even if there is no indication in the indicator that the threshold is applied.
- How to avoid getting data thresholds
- Change the reporting identifier to “device-based” and check again
- Create a report that does not apply thresholds such as “event name by number of events” in the exploration report
- Increase the time period covered by the report
- In the “Explore” report, remove dimension related to users
Additional reference 3:Indication of sampling availability

2. Aggregation with GA4xLooker Studio
Looker Studio is a data visualization tool offered free of charge as one tool of the Google Cloud Platform. It allows you to visualize your data using detailed and configurable graphs and tables, easily connects to a variety of data sources, and can be integrated with GA4 to create dashboards of KPIs and metrics to watch and monitor for your marketing targets.
There are two ways to aggregate GA4 data with data visualization tools.
One is to directly “specify GA4 properties” and aggregate the data, and the other is to “link BigQuery”.

1.When aggregating by directly “specifying GA4 properties
<Format of acquisition>
Data is acquired via API when connecting to GA4 from Looker Studio.
<Data to be acquired>
The same data as in the standard report is used for the aggregated data.
*Note
Some dimensions and indicators in the standard report cannot be obtained through the API. In addition, when other rows are displayed in Looker Studio, the values in the other rows are not included in the filter aggregation and correct data cannot be displayed.
Google help:https://developers.google.com/analytics/devguides/reporting/data/v1
Factors such as sampling, data thresholds, and problems with the API itself may make it difficult to determine the cause of whether data is being reflected correctly.
2.When “Linking BigQuery” is used for aggregation
When using “BigQuery integration,” you can handle GA4 raw data for dashboarding, which is more versatile than using aggregated data because raw data can be freely processed.
<Format of acquisition>
Export using the GA4 linkage function.
<Data to be acquired>
RAW data similar to the data used in the search report can be acquired.
*Notes
The data is not exactly the same, as it is only similar to the exploratory report.
Some data will not be output to BigQuery and can only be seen in the exploratory report.
You will need to design and build data tables for BI tools based on your analysis requirements.
*Because referencing with RAW data will increase the amount of data and slow down the operation.
3. Aggregation with GA4xBigQuery
BigQuery is a product offered as part of Google Cloud, Google’s cloud service, and is a data warehouse, BigQuery can process data as large as several TB (1 terabyte = 1,000 GB) or several PB (1 petabyte = 1,024 TB) in seconds or tens of seconds, enabling efficient analysis of a wide variety of data.
The following advantages can be achieved by linking GA4 and BigQuery.
・Analysis that cannot be achieved with GA4’s exploratory reports is possible.
・The ability to combine offline data, CRM data, and other external data for analysis enables the discovery of customer journeys that were previously unseen.
・GA4 can be used for analysis using machine learning functions on Google Cloud Platform.
・Analysis can be performed in conjunction with external BI tools (Tablueau, Power BI, etc.)

| Pros | Cons | Examples of recommended usage scenarios | |
| GA4 report
・Standard report |
・No need to create default reports as they are displayed in GA4
・No cost |
・It is easily affected by sampling and thresholds.
・Difficult to narrow down data ・Difficult to narrow down data |
・When using simple indicators to identify general trends
・To use for hypothesizing for analysis |
| GA4 report ・Exploration report |
・Easy to generate reports
・No cost |
・Difficult to share reports
・Difficult to share reports ・Difficult to get a complete picture of the data |
・For individual deep-dive analysis of data
・Trial before analyzing with Looker Studio or BigQuery ・To test hypotheses made using standard reports |
| GA4 x Looker studio | ・Easy to create without engineers or technical IT staffs | ・As with the standard report, if the amount of data is too large, it is aggregated into (other).
・Some dimensions and metrics are not available. |
・To allow users who are not authorized to view the GA4 report screen to view mainly simple dimension or metrics
・To check KPI and monitoring indicators |
| GA4xBigQuery | ・Easy to obtain data that is difficult and time-consuming to obtain on GA4’s report screen
・Analysis that is not possible with GA4’s exploration reports is possible. ・The analysis can be combined with offline data, CRM data, and other external data, enabling the discovery of customer journeys that were previously invisible. ・GA4 can be used for analysis using machine learning functions on Google Cloud Platform. ・Analysis can be performed in conjunction with external BI tools (Tablueau, Power BI, etc.) |
・Costly to build (requires engineers)
・Costly to refer to reports |
・When you want to visualize GA4 data precisely
・When you want to dig deeper into issues on a user-by-user basis ・When you want to analyze data integrated with other external data or offline data |
GA4 enables cross-device analysis based on users, and there are high expectations that it will enable access analysis that is more in line with actual conditions than UA. It is necessary to utilize reports according to various purposes and usage scenarios.
We offer GA4 implementation support services. Please feel free to contact us.